



A Databricks production readiness checklist tests whether a data platform can run business-critical workloads unattended, under audit and within budget.
Risk peaks right after the proof of concept, when pipelines built under one engineer’s account meet real users, real auditors and a real invoice.
Deployflow, a Databricks partner, built these seven checks for the Databricks Data Intelligence Platform from practices it already runs on AWS, Azure and GCP.
Databricks Production Readiness Checklist in 60 Seconds
- Rebuildable: production lives in code and ships through one automated path.
- Auditable: Unity Catalog shows who can see which data.
- Trustworthy: bad data stops before it reaches a report, and failures alert the data team first.
- Accountable: every pound of spend traces to a team.
- Recoverable: restores are rehearsed before launch.
- Go-live rule: every gap gets a grade and an owner. Expect about four weeks.
Why Pipelines Pass Their Tests While the Platform Still Fails
Databricks publishes its own production readiness checklist for Lakeflow pipelines. It confirms that a single pipeline is safe to schedule, with quality rules, triggers, failure alerts, the event log and a service principal identity in place.
Platform readiness answers a different question, and the difference shows up in the budget.
| Pipeline readiness | Platform readiness | |
| Question | Is this pipeline safe to schedule? | Can the platform take a twentieth pipeline, a second team and an external audit? |
| When it is decided | Per pipeline, at any time | Before the first workload goes live, then again for each new team or regulated data source |
| Cost of a late fix | One pipeline reworked | Every existing workload reworked |
| Who signs off | The pipeline owner | The head of data platform or CTO |
Late platform fixes cost more because they touch everything already built. Moving jobs from personal accounts to service principals means re-granting permissions object by object. Cost attribution is harder still. Tags and serverless usage policies apply only to usage recorded after they are set, so teams must match earlier spend by hand, job by job, and the result is open to dispute.
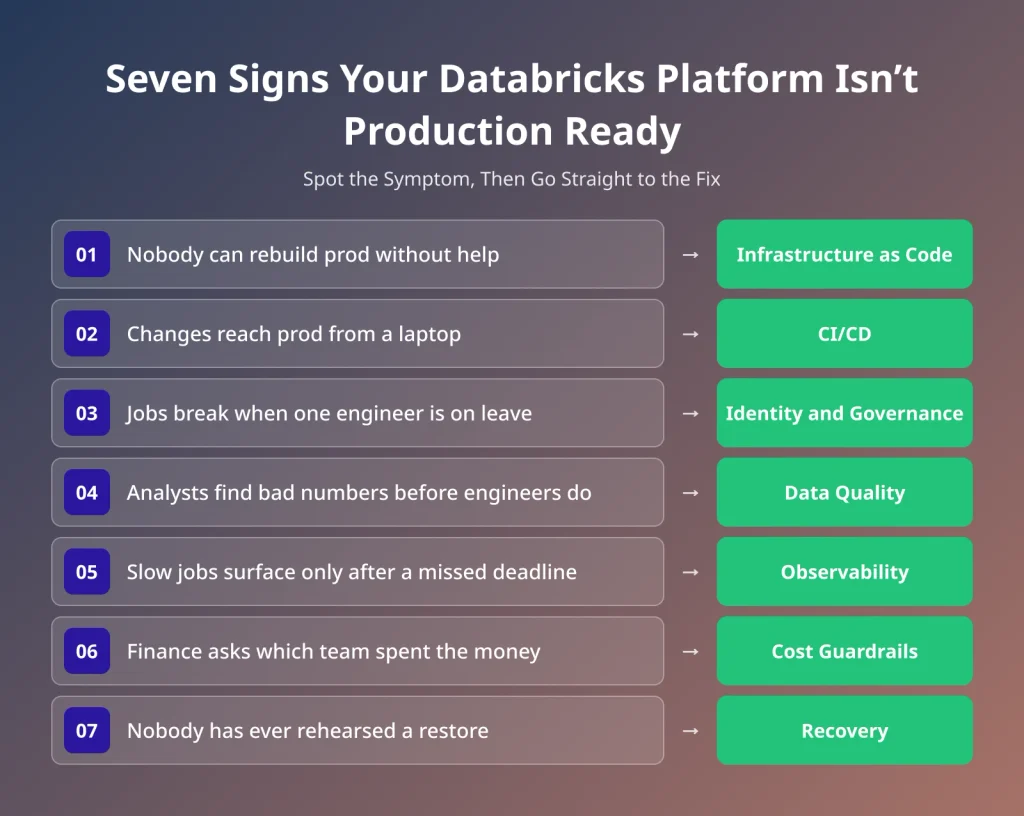
The 7-Point Databricks Production Readiness Checklist
Count an item as done only when evidence backs it: a pull request, a Terraform plan, an alert history or a drill log. That evidence doubles as audit material.
1. Can You Rebuild Production From Code?
The test: delete the staging workspace and rebuild it from the repository. Every manual step is a gap.
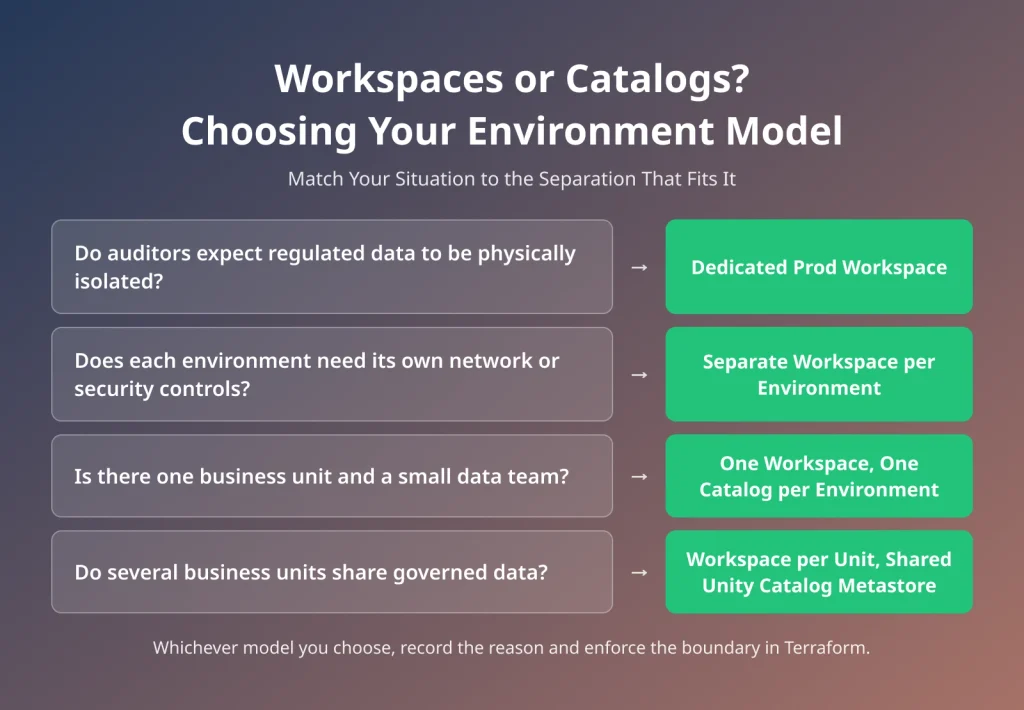
- Dev, staging and prod are separated using one of the models below.
- The Databricks Terraform provider defines workspaces, networking, storage credentials and permissions, changed only through reviewed pull requests.
- Hand-built prod resources are in code. The provider’s exporter generates Terraform from an existing workspace.
- Hosts, warehouse IDs and catalog names come from per-environment variables.
Code-defined environments also prevent configuration drift, a common source of hidden spend covered in how DevOps automation cuts cloud costs.
2. Does Every Change Reach Production the Same Way?
If nobody can say which commit runs in prod, releases depend on luck. Declarative Automation Bundles define jobs, pipelines, dashboards and permissions as code and deploy them through the Databricks CLI. A dependable promotion path:
- Dev: engineers deploy feature branches to personal targets in development mode, where schedules are paused so test copies never run overnight.
- Pull request: CI runs
databricks bundle validateand unit tests. - Staging: a merge to main deploys automatically, and integration tests run on representative data.
- Prod: a tagged release deploys as a service principal authenticated through OIDC, so no personal token touches production.
- Rollback: redeploy the previous tag.
Keep transformation logic in tested Python packages, with notebooks as thin entry points. Teams without CI/CD skills in-house can use DevOps managed services.
3. Who Can See What, and Can You Prove It?
Auditors and incident reviews ask the same five questions. Unity Catalog answers all of them from one governance layer.
| Question before go-live | How Unity Catalog answers it |
| Who can see sensitive data? | Grants, row filters and column masks |
| What breaks if this table changes? | Automated lineage, queryable in system tables |
| Which identity ran this job? | Service principals, logged in system.access.audit |
| How do joiners and leavers get or lose access? | SCIM provisioning into groups |
| Can partners get data without copies? | Delta Sharing under the same access controls |
Assign catalog and schema ownership to groups. Individual owners stall access decisions the day they leave.
4. Will Bad Data Stop Before It Reaches the Board?
A wrong number in a board pack does more damage than a failed run, because people act on it. Lakeflow Spark Declarative Pipelines (formerly Delta Live Tables) attach quality rules, called expectations, to each dataset. Every rule needs one deliberate behaviour:
- Warn (
expect) keeps the row and logs the failure. Use it only where someone watches the trend. - Drop (
expect_or_drop) discards the row. Pair it with a quarantine table for replay. - Fail (
expect_or_fail) halts the update. Reserve it for faults such as a broken primary key.
The pipeline event log records pass and fail counts per rule, so a falling pass rate shows up long before a stakeholder notices.
For tables outside pipelines, switch on data quality monitoring (formerly Lakehouse Monitoring) per schema. It learns normal freshness and completeness, flags anomalies and uses lineage to locate the source of a fault.
5. Will Your Team Hear About Failures First?
On a production-ready platform, the data team spots a broken pipeline first. Wire three signals before go-live.
Failed runs. Lakeflow Jobs sends failure notifications to shared destinations such as Slack, Microsoft Teams or PagerDuty. Personal inboxes go unread during holidays.
Slow runs. A duration threshold on each critical job flags gradual slowdowns weeks before a missed deadline.
Stale data. A job can succeed and still deliver yesterday’s figures. Agree a freshness target for each critical table, such as “finance tables ready by 07:00”, and enforce it with a Databricks SQL alert.
Back each signal with a short runbook for the three most common failures.
6. Can Finance Trace Every Pound of Databricks Spend?
Databricks bills creep up through oversized clusters, forgotten notebooks and over-frequent refreshes. Five guardrails stop most of it.
| Guardrail | Prevents | Set in |
| Compute policies | Oversized clusters, prod jobs on all-purpose compute | Workspace compute settings |
| Serverless usage policies (formerly budget policies) | Serverless spend no team claims | Workspace settings |
| Custom tags on classic compute | Cluster costs nobody can attribute | Cluster and job config |
| Auto-termination and triggered pipelines | Idle clusters, always-on pipelines | Cluster and pipeline settings |
| Budgets and alerts | Overspend found on the invoice | Account console |
Usage policies cover serverless spend only, so mixed estates also need tags on classic compute.
Track one metric weekly: the share of spend in system.billing.usage with no team tag. Spend without an owner rarely falls, a pattern explored in where UK cloud waste comes from.
7. Has Anyone Actually Rehearsed a Restore?
A recovery plan proves nothing until someone has run it. Run three drills before go-live:
- Undo a bad write. Restore a table with Delta time travel. Check the retention window first, because
VACUUMremoves deleted files after seven days by default. - Restart a broken stream. Recover a streaming pipeline after a checkpoint failure, and time it.
- Backfill cleanly. Reload a past date range and check for double counting.
Each drill should end with a procedure an on-call engineer can follow alone. For disaster recovery, deep clone critical tables to a second region and rebuild the rest from source. Agree that split with finance, because it drives storage cost.
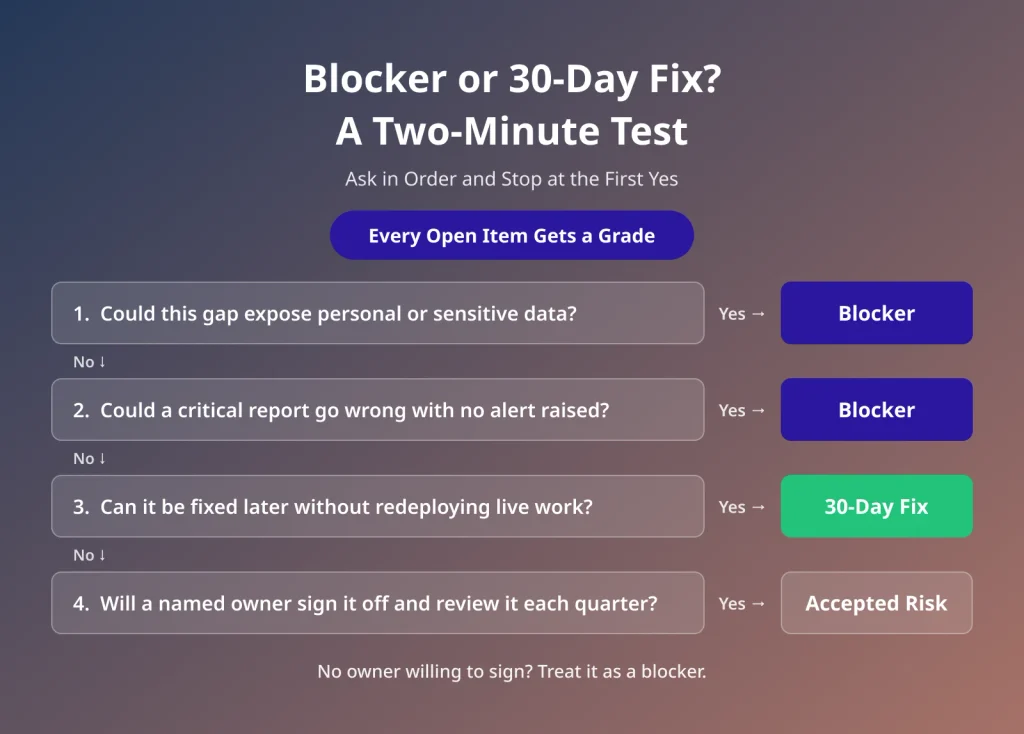
Blocker or 30-Day Fix? Scoring Readiness Without Delaying Launch
Grading each open item keeps every risk on record and stops a long checklist from delaying go-live.
- Blocker: the launch waits. Examples: prod jobs under a personal identity, missing failure alerts, unmasked sensitive data.
- 30-day fix: the launch proceeds with a dated commitment, such as a cost dashboard or a full runbook set. A missed date makes it a blocker for the next release.
- Accepted risk: the gap stays open by choice, with its impact recorded and the event that would force a fix, such as a new regulated data source.
Grade everything in one go/no-go session, with each owner showing evidence on screen. Decisions made there hold up better than sign-offs collected over email.
Who Owns Each Item on the Checklist
Responsibility blurs fastest at the hand-offs between platform, data and security teams, so the table pairs each owner with the Databricks control they actually hold.
| Area | Owner | Signs off | Databricks control |
| Infrastructure as code | Platform or DevOps | Head of data platform | Workspace admin via Terraform service principal |
| CI/CD | Data engineering | Platform team | Prod deployment service principal |
| Identity and governance | Security | Data owners | Metastore admin, SCIM |
| Data quality | Data engineering | Data consumers | Expectations, quality monitoring |
| Observability | Data engineering | Platform team | Job notifications, SQL alerts |
| Cost guardrails | Platform team | Finance or FinOps | Compute and usage policies, budgets |
| Recovery | Platform team | CTO or head of data | Retention settings, deep clone jobs |
Keep account and metastore admin roles to a few named people. Those roles can grant access to almost any object, so every extra holder widens the audit scope.
Your 30-Day Plan to a Production-Ready Databricks Platform
Each week builds on the last. Start the next only when the exit test passes.
Week 1: Foundations. Terraform environments, SCIM identity sync, service principals for deployment and jobs.
Exit test: staging rebuilds from the repository, and no prod job runs under a personal account.
Week 2: Delivery. Bundles, the CI pipeline and the promotion path.
Exit test: a merge to main reaches staging with no manual step.
Week 3: Detection. Expectations, failure and duration alerts, freshness targets and runbooks. Alerts defined in bundles ship with every deployment, so this week follows automation.
Exit test: a deliberately broken job triggers an alert in the on-call channel.
Week 4: Control. Cost guardrails, the three recovery drills and the go/no-go session.
Exit test: untagged spend is visible, each drill has a written procedure and every open item carries a grade.
If the month runs short, protect the blockers and grade everything else. A smaller platform that is genuinely ready serves the business better than a larger one held together by goodwill.
Ready to Take Databricks into Production?
Deployflow’s independent technical audit scores your Databricks platform against all seven checks, grades each gap as a blocker, 30-day fix, or accepted risk, and assigns an owner to each. Your team walks into the go/no-go session with the evidence ready, and Deployflow engineers can work alongside them to close the blockers.
Databricks Production Readiness Checklist: Frequently Asked Questions
How long does it take to make Databricks production-ready?
About four weeks for a focused team, provided identity and environments come first, because CI/CD, alerts and cost tags all depend on them. Most delays come from outside the data team, in identity provider changes, network approvals and security sign-off, so raise those requests on day one.
Should production workloads run on Databricks serverless compute?
Yes, for most scheduled jobs and pipelines. Databricks recommends serverless as the default for new pipelines: it starts quickly, scales automatically and stops billing when the work finishes. Keep classic compute for workloads that need specific instance types, init scripts or network setups that serverless doesn’t yet support, and check regional availability before committing.
Can Databricks keep data in the UK to meet UK GDPR?
Yes. Databricks runs in UK cloud regions, including AWS London and Azure UK South, and its data processing addendum covers UK GDPR. Residency is only part of compliance, though. Lawful processing, access controls and retention remain the organisation’s responsibility, and Unity Catalog supports them with column masks, row filters and audit logs.
Explore our BLOG
Recent articles
Apple’s Outage: Lessons in Safe Release Engineering
The Apple outage of 17 November 2026 was caused by an internal software update that...
read full article
Databricks Production Readiness Checklist: 7 Tests Before Go-Live
A Databricks production readiness checklist tests whether a data platform can run business-critical workloads unattended,...
read full article
Microsoft 365 Outage November 2026: What Failed and How to Keep Your Business Running
Microsoft 365 went down on 12 November 2026 and stayed down for almost 24 hours....
read full article